

The optimal placement of the assortment of a product group in the point of sale is much more complex than the result often suggests. Various requirements of retailers, suppliers and customers must be taken into account in the planning of the sales shelves. In addition to the manufacturer's demand to be placed "very visible", there is the retailers need to avoid "Out Of Stocks" on the one hand and "overstocking" on the other.
Especially for products with best-before dates, it is important to place an optimal capacity. In addition, quick and easy implementation in the stores must be ensured. The customer, on the other hand, needs all goods to be easy to find and available in sufficient quantities for a positive shopping experience.
In order to meet the customer's needs, it is imperative that the CDT (Customer Decision Tree), i.e. the system for which a customer searches for an item in a category, be taken into account in order to create the planograms. This information can be obtained by means of customer surveys, eye-tracking methods or receipt analyses.
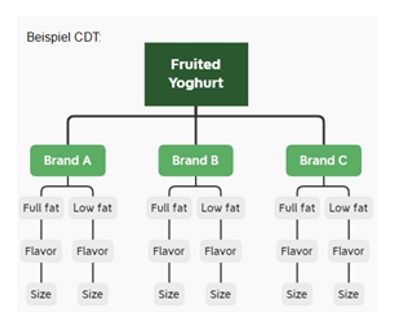 In the example beside, all items in the “Fruited Yoghurt” category should be placed in brand blocks. Per brand, the items are divided into "normal" and "fat reduced" and placed within that according to "taste" and "size".
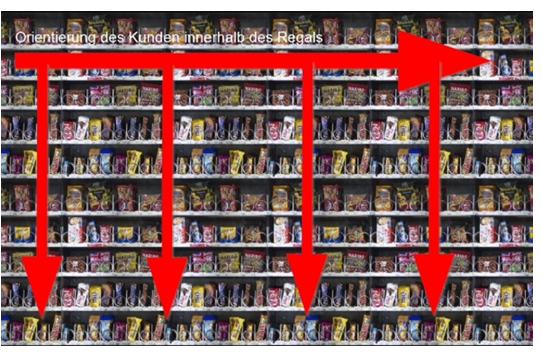
When creating the planograms, it is also important to be aware of the customers' orientation behaviour at the shelf. Accordingly, the customer always first looks at the shelf horizontally to get a basic overview of the assortment. For more precise placement details, the view is then directed vertically. That is why the correct placement of anchor brands is important for good orientation and a resulting positive shopping experience.
 Since we now know which system our customers use to search for articles within a product group (CDT) and we know the general orientation on the shelf, the placement must be aligned accordingly.
In theory, there are different placement methods, of which only the formation of cross blocks will be mentioned here, as these are used almost exclusively in practice. The cross block is structured in such a way that, following the CDT, the articles are placed horizontally according to their main distinguishing feature and the other segmentations are taken into account in the vertical placement.
The shelf itself is divided into different shelf zones with different values. The viewing and grip zones have a much higher value than the stretching and bending zones.
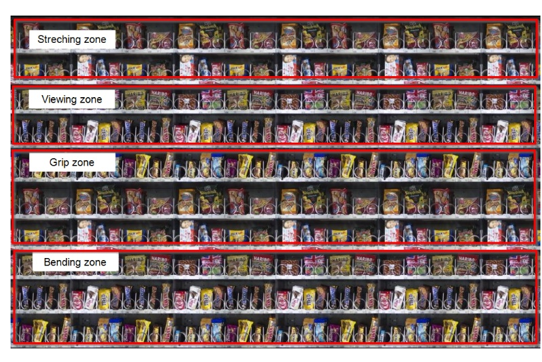
As already mentioned, anchor brands are very important for orientation on the shelf. Therefore, if they are available in the current category, they must be placed in the viewing zone. It also makes sense to place smaller light items in the stretch zone and heavy items in the bend zone. Fast-moving items should also be placed in the reach or view zone so that replenishment in the shop can proceed effectively.
Once the positions of each product on the shelf have been determined, it is important to place each item with the optimal number of sales units. This capacity is based on the delivery frequency; there must be enough items available until the next delivery. To calculate this minimum capacity, historical sales values are usually considered. Ideally, however, the required capacity is provided by an intelligent forecast system. In addition, it is also important to avoid placing too many items; on the one hand, to minimise markdowns for perishable goods and, on the other hand, to keep capital tied up on the shelf as low as possible for cost-intensive products.
At the latest now we reach a point in shelf planning, where the required and existing shelf space no longer match. This means that we need more sales space than is actually available to meet the requirements. Ultimately, it is now necessary to decide whether to either cut the range or expose yourself to the risk of out-of-stocks.
This danger always exists anyway if you do not yet work with store-specific planograms. Even with very granular cluster planograms, placement optimisations are always carried out on average values, which means that a final planogram does not fit one hundred percent in any branch that is to implement it.
Checklist for creating planograms:
• Customer Decision Tree
• Are there anchor brands
• Customer orientation on the shelf
• Shelf Values
• Optimal capacities according to delivery frequency, spoilage and capital commitment
Michael Krebs
Senior Business Consultant at Wysupp
3 May 2021